2019년 1월 17일 목요일

trade5 Elliott Browser 소개

■ 개 요

   trade5 Elliott Browser는 주가차트 분석 툴로서, 엘리어트 파동 분석 기능을 장점으로 하며, 실시간 신호 기능을 이용하여 트레이더의 매매를 지원하는 프로그램입니다.


그림 1. trade5 Elliott Browser 개요

   ※ 공개(Free) 버전 다운로드 ☞ https://youtu.be/xIf4JKbiD4Y
   ※ 사용법 기초 ☞ https://youtu.be/im1fuhmXBRk


■ 특 징

  
    1. 실시간 엘리어트 파동 분석
  
   파동에 대한 실시간 분석을 지원하며, 피보나치 비율에 기초한 차트 요소와 엘리어트 오실레이터를  활용하여, 파동 진행 파악에 도움을 줍니다.
  
    2. 실시간 신호
  
   설정된 피보나치 팬 라인, 추세선 또는 지지·저항을 기준으로 실시간 신호를 제공하여, 신속한 매매 대응을 지원합니다. 기술적 지표 기반 실시간 신호 기능도 제공합니다.
  
    3. 시계열 데이터 상관 분석
  
   시계열 데이터 사이의 상관분석 기능을 제공합니다. ※ 차기 버전의 Elliott Browser는 시계열 데이터 기계학습 기반 분석 기능을 포함할 예정입니다.


■ 주요 기능

  
    1. 증권사 API 활용 시세데이터 획득
  
   실시간 차트 출력에 필요한 틱 데이터는 증권사 API를 활용하여 획득합니다. 현재, trade5 Elliott Browser가 지원하는 증권사 API는 대신증권 Cybos Plus, 키움증권 Open API+키움증권 해외파생 Open API-W입니다.
  
    2. 실시간 분석 차트
  
   기술적 지표를 포함한 모든 분석 기능은 증권사 API를 통해 틱 데이터를 수신하는 즉시 실시간으로 처리되어 차트에 출력됩니다.
  
    3. 엘리어트 파동 분석
  
   Glenn Neely의 저서 'Mastering Elliott Wave'에 기술된 분석법에 따르는 ESPN 모드와, Bill Williams의 Fractal 기법과 ESPN 모드를 결합한 ESPNfr 모드를 지원합니다.
  

그림 2. ESPN 모드 엘리어트 파동분석
  

그림 3. ESPNfr 모드 엘리어트 파동분석
 
  
    4. 피보나치 비율 분석
  
   틱 데이터 수신에 따라 변화하는 파동에 대해, 피보나치 비율에 기초한 되돌림 비율 또는 파동의 목표치를 실시간으로 계산하여 차트에 출력합니다. ※ 그림 2, 3의 수평 Strip Line 참고

 
   사용자가 지정한 범위의 파동에 대한 피보나치 팬(Fan) Line을 차트에 출력하고, 각 Line의 Golden 및 Dead Cross 신호를 설정할 수 있습니다. ※ 그림 3의 추세선 참고

  
    5. 기술적 지표
  
   많이 사용되는 기술적 지표와 Bill Williams의 Profitunity Window를 지원합니다. 기술적 지표는 CCI, Disparity, MACD, OBV, RSI, Stochastic, 이동평균선 및 일목균형표를 포함합니다.    
  
  
    6. 실시간 신호
  
   사용자가 지정한 신호 조건(Trigger)에 해당하는 이벤트에 대해 실시간 신호를 제공합니다. 사용할 수 있는 신호 조건은 다음과 같습니다.
  • 엘리어트 파동 패턴
  • 피보나치 팬 Line Cross, 피보나치 비율 되돌림 수준 및 목표치
  • 사용자 지정 추세선
  • 기술적 지표 기반 신호
  
   7. 시계열 데이터 상관 분석
  
   사용자가 지정한 다수의 시계열 데이터에 대해 상관 분석 결과를 출력함으로써, 매매 결정에 참고할 수 있도록 합니다. ※ 차기 버전의 Elliott Browser는 시계열 데이터 기계학습 기반 분석 기능을 포함할 예정입니다.
  

그림 4. 시계열 데이터 상관 분석


2018년 12월 13일 목요일

trade5 Quant 소개

  ■ 개 요

  trade5 Quant는 주식 투자의 전 과정, 즉 종목을 탐색하고, 몇몇 종목에 대해 진입을 한 후, 청산과 관리를 하는 과정에서기술적 분석과 더불어 퀀트 분석과 그에 기반한 실시간 신호를 제공함으로써주식 투자자들의 성공 투자를 돕는 소프트웨어입니다.


  ■ 특 징

  trade5 Quant의 특징은 개인용 소프트웨어로서, 
  1. 데이터 수집에 있어 비용 효과적입니다.
  2. 종목 탐색에 있어 자동화된 퀀트 분석과 평점으로 시간 효율적입니다.
  3. 기술적 지표와 엘리어트 파동 분석 기법 등 검증 가능한 가시적 전략을 구사할 수 있습니다.
  4. 진입과 청산의 적시성을 위한 실시간 신호를 제공하며,
  5. 포트폴리오 관리 등 수익성과 효율성 제고를 위한 관리 기능을 제공하는
  trade5 Quant는 핵심적인 기능을 포괄하는 퀀트 용 툴입니다.


  ■ 이 점

  trade5 Quant의 이점은 성공투자의 확률을 높일 수 있다는 것입니다. 즉, 기술적 분석과 더불어, 엘리어트 파동 분석 기법을 활용하고퀀트 기능을 통한 기본적 분석 결과를 함께 적용하여 매매 전략을 구사할 수 있도록 하고투자의 전 과정을 관리하도록 함으로써, 수익률을 높이는데 기여합니다.
  

2018년 7월 1일 일요일

KOSPI 퀀트 6 - ROE 기반 종목추출

ROE (Return on Equity) 관련 데이터로 종목을 추출하는 작업의 타당성을 검토해 봅니다.

관련 데이터 및 통계는 다음과 같습니다.

  1. ROE 지표와 1년 주가상승률 분포 
  2. 성장성이 증가하는 경우의 1년 주가상승률 분포 
  3. 2년 연속 25% 이상 성장하는 경우의 1년 주가상승률 분포


2018년 6월 21일 목요일

KOSPI 퀀트 5 - 피보나치 팬 라인 II

6월 21일, KOSPI200 선물 9월물 15분봉 실시간 차트의 9:15 ~ 9:30 녹화분입니다.

차트 상의 피보나치 팬 라인들을 확인해 보시기 바랍니다.
(영상 중간에 나오는 KOSPI200 지수의 첫 차트는 월봉이 아닌 주봉 차트입니다.)


2018년 6월 21일 장 종료 후, KOSPI200 지수 주봉 차트의 파동분석을 해봅니다.
필자의 주관적인 관점입니다. 유의하십시요.

2016년 2월 첫 주부터 시작된 충격패턴이 현재 (IV) 파동을 전개하고 있다고 가정하고, 파동 (IV)의 기대 목표 지수를 파악해 보겠습니다.

KOSPI200 지수 주봉 차트, 2018-06-21


  • (IV),1 ⇒ (III) 파동의 0.382 되돌림 수준 303.8
  • (IV),2 ⇒ (I) 파동의 0.382 피보나치 팬 라인 지지 수준 299.7
  • (IV),3 ⇒ (III) 파동의 0.5 되돌림 수준 293.6
  • (IV),4 ⇒ (III) 파동의 0.618 되돌림 수준 283.4
 
엘리어트 파동이론의 Alternation Rule을 감안한다면, 파동 (II)의 (I)에 대한 되돌림이 짧으므로, 파동 (IV)의 되돌림 수준은 50% 이상이 될 수 있으므로, 기대 지수는 위 네 가지 가능성 중에 세 번째와 네 번째까지 열려 있습니다.

하지만, 299 정도에서 지지되기를 기대해 봅니다.


KOSPI 퀀트 4 - 피보나치 팬 라인

피보나치 팬 라인에 대한 짧은 얘기입니다.

6월 20일자 KOSPI200 선물 9월물 15분봉 차트를 Replay하면서,

이전 6월 12일에 생긴 파동의 팬 라인들이
20일의 지수 움직임에 미치는 영향이 있는지 확인해 봅니다.


2018년 6월 17일 일요일

KOSPI 퀀트 3

종목들에 대해 Rating을 하기 위한 척도(Metrics)와, 통계의 필요성을 Magic Formula와 Piotroski F-Score 사례로 얘기합니다.


2017년 9월 6일 수요일

Developing ElliottBrowser for Quandl.Com - 6


Getting the Sources and Running


    ElliottBrowser for Quandl.Com is a .NET form application written in C#, and its main functionalities can be summarized as 'a tool for technical analysis of US stocks, with data fed from Quandl'.

    Of course, free data provided by Quandl are not limited to US stocks, so anyone who want to analyze other data from Quandl or any data from any other data provider may use ElliottBrowser after modifying it a bit accordingly.


▷ Getting and Building the Sources


    The sources of ElliottBrowser for Quandl.Com and its necessary libraries have been published in a GitHub repository.

    In the source tree, is a Visual Studio solution file. After cloning or downloading the repository, it is enough to open and build the solution file with Visual Studio Community 2015 or compatible.


▷ Running ElliottBrowser


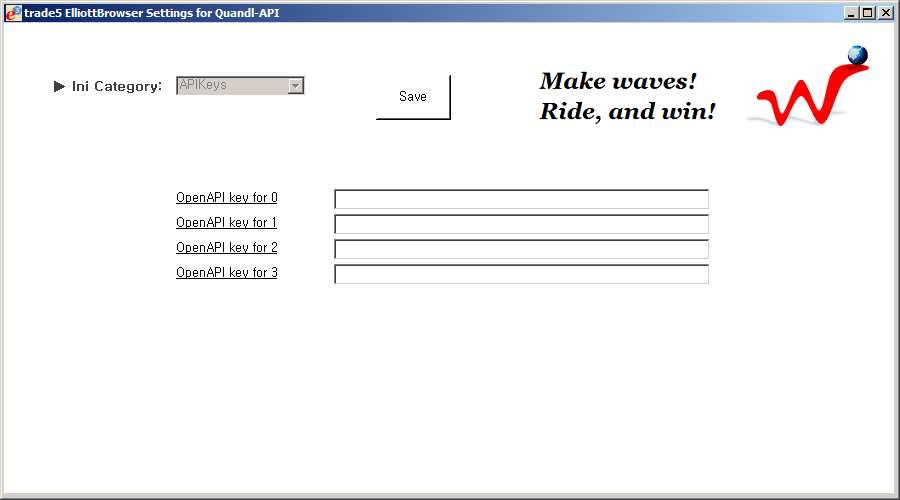
    As stated, it is necessary to have a valid Quandl API key to run ElliottBrowser. If it's not the case, visit Quandl and register to get a free account first.

    Every time when ElliotBrowser is starting, it tries to read one of its .ini file to get an API key. If it fails, it prompts the user to fill in a key. See below.


Fig 1. Running ElliottBrowser for Quandl.Com


Fig 2. Filling in an API key

    As in Fig 2, after filling in at least one API key, click 'Save', and then click 'Data Provider' button in the main toolbar (See Fig 1).

    Again, ElliottBrowser tries to read URL format string of Quandl API, and prompts the user if it fails.


Fig 3-1. Ini file checking


Fig 3-2. Ini file checking


Fig 4. Setting a default dataset

    Set the 'DatabaseDefault' field to 'WIKI', and the 'DatasetDefault' field to any valid ticker symbol, and click 'Save'.

    After that, click the 'Data Provider' button in the main toolbar once again.


▷ Using ElliottBrowser


    To learn the basic usages, please check the previous blog post.


2017년 9월 1일 금요일

Developing ElliottBrowser for Quandl.Com - 5


User Interface of ElliottBrowser


    ElliottBrowser is a .NET form application which will be developed using Visual Studio Community 2015 having no other 3-party UI components.

    Let's look at its main form. It contains a StatusStrip and a horizontal SplitContainer with fixed Panel1 in which a ToolStrip is docked.


Fig 1. ElliottBrowser's Main Form

    Inside the Panel2 of the SplitContainer, another vertical SplitContainer will be docked, which has fixed Panel1 to be added the panel of symbols docked inside and Panel2 being to have a panel of charts. See Fig 1 of the first blog post in this series.

    The chart panel of ElliottBrowser is a UserControl 'CChartPanel', which is also a horizontal SplitContainer having a ToolStrip docked in fixed Panel1, and a Chart control and a DataGridView control in Panel2. See below.


Fig 2. Chart Panel, CChartPanel


▷ Functional Design


   - Main ToolStrip


Fig 3. Main ToolStrip

  1. When clicked, the panel of symbols shows up or disappears.
  2. A ToolStripComboBox lists ticker symbols once requested by a user. When a user requests a chart of a stock through the panel of symbols, corresponding ticker symbol is added to the list. When an item in the list is selected, the chart of the selected symbol is displayed.
  3. A ToolStripButton toggles the multiple selection mode of period buttons in 4 on/off. When the mode is on and two or more period buttons are checked, multiple charts per checked button are displayed.
  4. ToolStripButtons for supported periods are enabled. When clicked, they toggle themselves check/unchecked. ※ Supported periods are dependent to the data provider. Quandl.Com supports only monthly, weekly and daily charts.
  5. A TextBox, when a valid number entered, sets the number of candlesticks in all displayed charts.
  6. A ToolStripSplitButton, when a dropdown button clicked, selects a data provider and verifies the configuration files of the provider to check API keys and URLs.
  7. When clicked, a form displaying the information of ElliottBrowser shows up.


    - Panel of Symbols


Fig 4. The Panel of Symbols

  1. A ListView lists ticker symbols in Quandl.Com's WIKI database. When an item in the list is clicked, the corresponding ticker symbol is added to the ToolStripComboBox (Fig 3. 2) in the main ToolStrip, while ElliottBrowser displaying the charts.
  2. A ComboBox accepts and lists user inputs for search. When a user inputs a string into box, the panel of symbols searches for the string among the list of symbols and highlights one, if any searched.
  3. If clicked, the panel of symbols searches an item with the string in the ComboBox.


    - CChartPanel Tool Bar


Fig 5. CChartPanel Tool Bar

  1. A ToolStripSplitButton has dropdown items for chart periods, monthly, weekly, daily, and minutes. By default, its action is disabled and displays the period of the chart only.
  2. A ToolStripComboBox lists supported periods less than daily. By default, it is disabled.
  3. A TextBox, when a valid number entered, sets the number of candlesticks in the chart.
  4. A HScrollBar sets the number of candlesticks in the chart.
  5. A ToolStripSplitButton has dropdown items for supported technical indicators other than TiESPN, TiESPNfr, and PFTW in WnFTechnicalIndicators.dll. If one of the dropdowns is clicked, corresponding technical indicator is displayed in the chart.
  6. A ToolStripSplitButton has dropdown items for TiESPN, TiESPNfr and PFTW (Bill Williams' Profitunity Window).
  7. A ToolStripButton changes the mode of mouse action on the chart cyclically from 'SP Notation' → 'Trend Line' → 'Ratio' → 'SP Notation'. 
  8. A ToolStripButton, which is enabled when the mode of the button 7 is 'Trend Line' or 'Ratio', shows a ColorDialog to choose the line color.
  9. A ToolStripSplitButton has two dropdown items to print the chart either to a printer or to an image.
  10. If clicked, the UI control of the chart panel is toggled to either Chart for charting or DataGridView to view the data source of the chart.


    - The modes of mouse action on the Chart control

      SP Notation: If a user draws a horizontal block on the chart to select a wave, ElliottBrowser analyzes the wave, while regarding it as a mono-wave, and displays the result, i.e., its SP notation.
 
      Trend Line: Users can draw some straight lines on the chart.
 
      Ratio: If a user subsequently draws two straight lines so that they are connected to each other, the retrace ratio of the second line to the first is displayed, and the target range of 1.618 to 2.618 times of the first line is also depicted with two horizontal strip lines.


2017년 8월 31일 목요일

Developing ElliottBrowser for Quandl.Com - 4


Applying Elliott Wave Analysis to a Chart


    Readers may have been heard of the Elliott Wave Principle. The purpose of this post is not to talk about the principle itself or some controversial topics about it, but to introduce two technical analysis tools based on the methods described in 'Mastering Elliott Wave', a Glenn Neely's book.

    Let's proceed directly with the tools. The two differ in how they define mono-waves. Of course, according to the book, there is only one way to define them, and one of the tools adopts it. The other tool uses the concept of 'fractals' in the book 'Trading Chaos' by Bill Williams, and it considers a mono-wave as a wave between a fractal and its adjacent opposite fractal.

    In terms of ElliottBrowser, they are technical indicators TiESPN (Technical indicator for Elliott wave Structure & Progress Notation) and TiESPNfr, respectively, and both analyze given chart data to produce SP (Structure & Progress) notations of each mono-wave in the chart. And both include the Elliott oscillator, i.e., MACD(5, 34, 5) as an auxiliary indicator. See Fig 1 and 2.


Fig 1. ESPN, Alphabet Inc. 2017.08.28


Fig 2. ESPNfr, Alphabet Inc. 2017.08.28


    This post will not treat the details on how TiESPN and TiESPNfr work, but will cover briefly how to use them, Instead. Actually, they are classes included in the library WnFTechnicalIndicators.dll, and which in turn uses WnFElliottWave.dll, the Elliott wave analysis library of Wave And Fractals Co., Ltd.


▷ Some Technical Specifics


    There are 3 ways to apply Elliott wave analysis to a chart data, and it's enough to use one of them.

    1. Using TiESPN or TiESPNfr

using WnFTechnicalIndicators;

    ...
    Chart ch;
    WnFTechnicalIndicators.TI ti;
    ...
    WnFCandles candles = WnFElliottBrowser.Factory.GetCandles(_symbol, _period, CommodityType.None);
    TechnicalIndicator indicator;

    if (ti == TI.ESPN)
    {
        indicator = new TiESPN();
    }
    else if (ti == TI.ESPNfr)
    {
        indicator = new TiESPNfr(new int[]{ 5 });
    }
    
    indicator.Init(candles.DOHLCV);
    ch.DataSource = indicator.Data;


    2. Using 'IndicatorSignal' instance

    Along with several technical indicator classes, the library contains the 'IndicatorSignal' class, the usage of which is to raise events (or notification) in real-time environment based on the conditions of its companion technical indicator.

    This method is more general so that we can apply technical indicators, other than TiESPN or TiESPNfr, to a chart.

    Chart ch;
    WnFTechnicalIndicators.TI ti;
    ...
    WnFCandles candles = WnFElliottBrowser.Factory.GetCandles(_symbol, _period, CommodityType.None);
    ...
    string sstr = IndicatorSignal.GetDefaultSigStr(ti, (CandlePeriod)_period);
    IndicatorSignal isig = new IndicatorSignal((CandlePeriod)_period, sstr, ti);
    // Setting a companion technical indicator of the IndicatorSignal instance
    isig.Indicator = IndicatorSignal.IStrToObj(isig.TI, isig.IStr);
    isig.Indicator.Init(candles.DOHLCV);
    ch.DataSource = isig.Indicator.Data;


    3. Using WnFElliottWave.dll directly

    WnFElliottWave.dll library contains 2 classes, ElliottWave and MacroWave. ElliottWave corresponds to a mono-wave, and MacroWave represents a collection of linked mono-waves.

    Given a line chart, a MacroWave instance finds mono-waves and analyzes them based on the methods described in the Glenn Neely's book 'Mastering Elliott Wave'.

using WnFElliottWave;

    ...
    Chart ch;
    WnFCandles candles = WnFElliottBrowser.Factory.GetCandles(_symbol, _period, CommodityType.None);
    
    candles.DOHLCV.Columns.Add("ESPN", typeof(double), "(High+Low)/2");   // Mean Price
    candles.DOHLCV.Columns.Add("ESPN_SP", typeof(string));                // SP notations

    MacroWave eph = new MacroWave();
    eph.mplist = candles.DOHLCV.AsEnumerable().Select(r => r.Field("ESPN")).ToArray();
    eph.monoize();
    eph.analyze(WnFElliottWave.EPAM.DE);
    
    foreach (ElliottWave li in eph.mw_list.Values)
    {
        candles.DOHLCV.Rows[li.liS]["ESPN_SP"] = li.mSP;
    }
    
    ch.DataSource = candles.DOHLCV;


    There are 3 modes of analysis, which are typed to the enum WnFElliottWave.EPAM. See below.

namespace WnFElliottWave
{
    [Guid("F021AB8E-F16D-4EB0-A268-8C26A8E6C812"), ComVisible(true)]
    public enum EPAM
    {
        DE = 0,    // Default - Analyzes all mono-waves
        SI = 1,    // Skips very small, i.e., non-similar mono-waves
        DI = 2     // Analyzes directional movements
    }
}


2017년 8월 29일 화요일

Developing ElliottBrowser for Quandl.Com - 3


Downloading / Storing Chart Data Incrementally - 3


    In this blog post, let's talk about the database usage of ElliottBrowser. As noted before, it's necessary to use a local data store to enable the idea of 'incremental download', or 'fresh-download first and append later'.

    Then, what would we use as a local data store?  It may be that the most preferable choice is to use a RDBMS such as MySQL, PostgreSQL, or to use a NoSQL database. But because the data structure under our consideration, actually time series in stock charts, is too simple and formal, using a database system may be too much. Even so, we cannot store our data to some local files while caring about all IO and some additional processing.

    Assuming we will use a database system, but not limited to a specific one, and let's talk about what we need more in that case. The main point of view is how to reduce the dependency to a specific database while allowing as many preferences to databases as possible to developers.

▷ Functional Design for Database Accesses


    1. ElliottBrowser adopts a wrapper class, 'WnFDbConnectionWrapper', so that we can respond easily to database changes. ※ For those who want to use databases other than MS SQL Server Compact, it's enough to implement an subclass of the wrapper class.

    2. We keep the wrapper class most simple. Its functions are as follows
       - Creating a wrapper object per database (F.Req.1)
       - Getting the last candlestick per chart data, if any (F.Req.2)
       - Inserting / appending / getting candlesticks per chart data (F.Req.3~5)


▷ Some Technical Specifics


    1. Abstracting database access

public enum WnF_DBType
{
    SQLCE = 0,
    MySQL = 1,
    SQLite = 2
}

public class WnFDbConnectionWrapper : IDisposable
{
    public WnFDbConnectionWrapper(WnF_DBType k, string s)
    {
        if (string.IsNullOrEmpty(s))
            throw new ArgumentException("Connection String Empty", "connStr");
        connStr = s;
        type = k;
    }

    // F.Req.1
    public static WnFDbConnectionWrapper GetWrapper(WnF_DBType k, string s)
    {
        WnFDbConnectionWrapper wrpper = default(WnFDbConnectionWrapper);

        if (k == WnF_DBType.SQLCE)
        {
    retry:
            wrpper = new SqlCeWrapper(k, s);
            if (!wrpper.InitConnection())
            {
                wrpper = null; Thread.Sleep(10);
                goto retry;
            }
        }
        else
            throw new NotImplementedException();

        return wrpper;
    }

    #region " IDisposable Support "
    /// Keep track of when the object is disposed. 
    protected bool disposed = false;
    /// This method disposes the base object's resources. 
    protected virtual void Dispose(bool disposing)
    {
        if (!this.disposed)
        {
            if (disposing)
            {
                /// Insert code to free managed resources.
                if ((conn != null)) conn.Close();
            }
            /// Insert code to free unmanaged resources. 
        }
        this.disposed = true;
    }

    /// Do not change or add Overridable to these methods. 
    /// Put cleanup code in Dispose(ByVal disposing As Boolean). 
    public void Dispose()
    {
        Dispose(true);
        GC.SuppressFinalize(this);
    }
    #endregion

    public DbConnection Connection
    {
        get { return conn; }
    }

    public bool InitConnection()
    {
        SetupConnection();
        return (conn != null);
    }

    // F.Req.2
    public StockOHLCV CheckTable(int p, string s, out string sn)
    {
        StockOHLCV lastC = default(StockOHLCV);
        sn = TableName(p, s);
        if (Exists(sn))
            lastC = LastRow(sn);
        else
            CreateTable(sn, p);
        return lastC;
    }

    // F.Req.3
    public virtual void InsertTable(DataTable dt) { }

    // F.Req.4
    public int AppendTable(DataTable dt)
    {
        if (!DeleteRow(dt.Rows[0])) throw new Exception("DeleteRow failed");
        InsertTable(dt);
        return dt.Rows.Count;
    }

    // F.Req.5
    public virtual int FillRows(int p, string s, int n, ref DataTable dt_in)
    {
        return 0;
    }


    protected WnF_DBType type;
    protected string connStr;
    protected DbConnection conn;


    protected virtual void SetupConnection() { }

    protected virtual bool Exists(string cname)
    {
        return false;
    }

    protected virtual StockOHLCV LastRow(string cname)
    {
        return default(StockOHLCV);
    }

    protected virtual void CreateTable(string cname) { }

    protected string TableName(int p, string s)
    {
        string t = null;
        int i = 0;
        if (int.TryParse(s, out i))
            t = "_" + s;
        else
            t = s;
        t = t.Replace(".", "D_").Replace("#", "_S_").Replace("@", "_AT_").Replace("-", "_DS_") + "_" + p;
        return t;
    }

    protected bool DeleteRow(DataRow dr)
    {
        bool b = true;
        string sql = "delete from " + dr.Table.TableName + " where DateTime Like '"
                                    + ((string)dr["DateTime"]).Substring(0, 10) + "%'";

        try
        {
            using (DbCommand cmd = conn.CreateCommand())
            {
                cmd.CommandText = sql;
                cmd.ExecuteNonQuery();
            }
        }
        catch (Exception ex)
        {
            Console.WriteLine("[WnFDbConnectionWrapper.DeleteRow()] Exception: " + ex.Message);
            b = false;
        }
        return b;
    }
}


    2. Wrapper for MS SQL Server Compact

public class SqlCeWrapper : WnFDbConnectionWrapper
{
    public SqlCeWrapper(WnF_DBType k, string s) : base(k, s)
    {
    }

    protected override void SetupConnection()
    {
        try
        {
            string strds = connStr.Split(';')[0];
            strds = strds.Split('=')[1];
            if (!File.Exists(strds))
            {
                SqlCeEngine engine = new SqlCeEngine(connStr);
                engine.CreateDatabase();
            }
            conn = new SqlCeConnection(connStr);
            conn.Open();
        }
        catch (Exception ex)
        {
            Console.WriteLine("Exception at SqlCeWrapper.SetupConn()\r\n" + ex.Message);
            if (conn != null)
            {
                conn.Close();
                conn = null;
            }
        }
    }

    protected override bool Exists(string cname)
    {
        bool b = false;
        if (cname != string.Empty)
        {
            SqlCeCommand mycommand = ((SqlCeConnection)conn).CreateCommand();
            string sql = "SELECT Count(*) FROM INFORMATION_SCHEMA.TABLES WHERE TABLE_NAME='" + cname + "'";
            mycommand.CommandText = sql;
            b = (Convert.ToInt32(mycommand.ExecuteScalar()) > 0);
        }
        return b;
    }

    protected override StockOHLCV LastRow(string cname)
    {
        StockOHLCV lastC = default(StockOHLCV);
        string sql = "select * from " + cname + " where DateTime IN (select MAX(DateTime) from " + cname + ")";
        SqlCeCommand mycommand = ((SqlCeConnection)conn).CreateCommand();
        mycommand.CommandText = sql;
        try
        {
            lastC = new StockOHLCV(Convert.ToString(mycommand.ExecuteScalar()), 0, 0, 0, 0, 0);
        }
        catch (Exception ex)
        {
            Console.WriteLine("Exception at SqlCeWrapper.LastItem()\r\n" + ex.Message);
        }
        return lastC;
    }

    public override void InsertTable(System.Data.DataTable dt)
    {
        using (SqlCeCommand cmd = new SqlCeCommand())
        {
            cmd.Connection = (SqlCeConnection)conn;
            cmd.CommandText = dt.TableName;
            cmd.CommandType = CommandType.TableDirect;

            using (SqlCeResultSet rs = cmd.ExecuteResultSet(ResultSetOptions.Updatable | ResultSetOptions.Scrollable))
            {
                foreach (DataRow r in dt.Rows)
                {
                    SqlCeUpdatableRecord record = rs.CreateRecord();
                    foreach (DataColumn col in dt.Columns)
                        record.SetValue(dt.Columns.IndexOf(col), r[col]);
                    rs.Insert(record);
                }
            }
        }
    }

    private string _create_fields()
    {
        return " (DateTime NVARCHAR(19) PRIMARY KEY, [Open] REAL, High REAL, Low REAL, [Close] REAL, Volume REAL)";
    }

    protected override void CreateTable(string cname)
    {
        string sql = "create table " + cname + _create_fields();
        SqlCeCommand mycommand = ((SqlCeConnection)conn).CreateCommand();
        int rcnt = 0;

    ReCreateSqlCe:
        try
        {
            using (SqlCeTransaction trn = ((SqlCeConnection)conn).BeginTransaction())
            {
                mycommand.CommandText = sql;
                mycommand.Transaction = trn;
    RetrySqlCe:
                try
                {
                    mycommand.ExecuteNonQuery();
                    trn.Commit();
                }
                catch (Exception ex)
                {
                    Console.WriteLine("Exception at SqlCeWrapper.CreateTable(), Retry count " + rcnt + "\r\n" + ex.Message);
                    if ((trn != null)) trn.Rollback();
                    if (rcnt < 3)
                    {
                        rcnt += 1;
                        Thread.Sleep(2000);
                        goto RetrySqlCe;
                    }
                }
            }
        }
        catch (SqlCeException ex)
        {
            if (Strings.InStr(ex.Message, "locked") > 1)
            {
                Thread.Sleep(1000);
                goto ReCreateSqlCe;
            }
        }
    }

    public override int FillRows(int p, string s, int n, ref DataTable dt_in)
    {
        int ccnt = 0;
        string sql = "select TOP (" + n + ") * from " + s + " order by DateTime desc";
        SqlCeCommand mycommand = ((SqlCeConnection)conn).CreateCommand();
        mycommand.CommandText = sql;

        SqlCeDataAdapter da = new SqlCeDataAdapter(mycommand);
        DataColumn col = new DataColumn("row_num", typeof(Int32));
        col.AutoIncrement = true;
        col.AutoIncrementSeed = 0;
        dt_in.Columns.Add(col);

        DataTable dt = new DataTable();
        DataTableReader dtReader = default(DataTableReader);

        try
        {
            ccnt = da.Fill(dt);
            if (ccnt > 0)
            {
                dt = dt.Select(string.Empty, "DateTime Asc").CopyToDataTable();
                dtReader = new DataTableReader(dt);

                dt_in.BeginLoadData();
                dt_in.Load(dtReader);
                dt_in.EndLoadData();
            }
        }
        catch (Exception ex)
        {
            Console.WriteLine("Exception at SqlCeWrapper.FillCandles()\r\n" + ex.Message);
        }

        return ccnt;
    }

}


2017년 8월 28일 월요일

Developing ElliottBrowser for Quandl.Com - 2


Downloading / Storing Chart Data Incrementally - 2


    In the last blog post, I covered deserialization of JSON string into a data type defined in ElliottBrowser. This post deals with the process of storing time-series data into a database.

    Just as ElliottBrowser keeps the list of stocks locally in the form of a .zip file downloaded from Quandl and refreshes the file whenever it is required, it treats chart data in a similar fashion except that the data is stored in a database.

    First, let us consider the use case. When a user select a ticker symbol in the ElliottBrowser's panel of symbols, ElliottBrowser fetches the chart data of the corresponding stock. When there's no data of the stock being kept by ElliottBrowser itself, it downloads them from Quandl.Com as many as possible (fresh-download). If the data is of significant size, the user should wait for a while to see the chart.

  How do we reduce the users' waiting time, which they may feel bored, while downloading the data? It's simple. Let's hide the download process into the background, and display the requested chart with only a small amount of data.

    If the user has viewed the stock chart at least once, the data of the stock has been stored in the database, so it is enough to download only the changed part of the data (append).


▷ Some Technical Specifics


    1. 'StockOHLCV', a type representing a bar (or candlestick) in a stock chart with volume

public struct StockOHLCV
{
    public string D;
    public double O;
    public double H;
    public double L;
    public double C;
    public double V;

    public StockOHLCV(string _d, double _o, double _v)
    {
        D = _d; O = _o; H = _o; L = _o; C = _o; V = _v;
    }

    public StockOHLCV(string _d, double _o, double _h, double _l, double _c, double _v)
    {
        D = _d; O = _o; H = _h; L = _l; C = _c; V = _v;
    }
}


    2. 'WnFCandles', a type representing the 'chart data' of a stock

    We will use a System.Windows.Forms.DataVisualization.Charting.Chart object for charting, DataSource property of which needs to be set in runtime. For the data type of the DataSource, DataTable is enough.

    When we instantiate an WnFCandles object for a stock chart, let's mark the last candlestick of the chart data, if any, stored in the database for the purpose to decide whether to fresh-download or to append.

public class WnFCandles
{
    protected int _period;
    protected string _stockcode;    // the ticker symbol of the stock
    protected DataTable _dohlcv;    // the whole candlesticks to be set as the DataSource
    protected StockOHLCV _last;     // the last candlestick in the chart
    ...

    public WnFCandles(int p, string s)
    {
        if (!ValidPeriod(p)) throw new ArgumentException("Invalid candle period " + p);
        _period = p;
        _stockcode = s;
    }

    public string Symbol
    {
        get { return _stockcode; }
    }

    public int Period
    {
        get { return _period; }
        set { _period = value; }
    }

    public DataTable DOHLCV
    {
        get { return _dohlcv; }
        set
        {
            if (value == null) throw new ArgumentNullException();
            if (value.Rows.Count == 0) throw new ArgumentException("Candles vacant");
            _dohlcv = value;
        }
    }

    ...
}


    3. Separating first-time charting and fresh download

    There are some more things to talk about, such as an interface type and a database connection wrapper class, but let's focus only on the use case mentioned above.

    In response to a user's request for a chart, on instantiating an WnFCandles object for the chart data, ElliottBrowser checks if the last candlestick is set. If it's the case, ElliottBrowser downloads recent data first and displays a chart. But if not, it invokes a separate thread which starts fresh download followed by database table insertion, and its main thread downloads small portion of data to display a chart. See 'GetCandles()' method below.

public class QuandlChart : WnFCandles
{

    public QuandlChart(int p, string dataset, string database, WnFDbConnectionWrapper _wrpper = null) : base(p, dataset)
    {
        _database = database;
        _api = (QuandlAPI)WnFElliottBrowser.Factory;
        _set_dbconn(_wrpper);
        _init_candles();
    }
    
    ...
    
    private QuandlAPI _api;
    private string _database;
    private WnFDbConnectionWrapper _dbc_wr;
    private bool _dbc_wr_owner;
    private string _tname;

    public int GetCandles()
    {
        QuandlAPI.QuandlError err = default(QuandlAPI.QuandlError);
        DataTable dt = default(DataTable);
        bool append;
        string d1, d2;
        int no_candles = 0;
        string fstr;
        
        string fstr;
        if (!_api.ReadURLString("Candles", out fstr))
        {
            MessageBox.Show("Error reading URL format string for candles.", Properties.Settings.Default.tm, MessageBoxButtons.OK);
            return (int)APIError.APIUrlFormat;
        }

        append = _is_append(out d1);
        d2 = DateTime.Today.ToString("yyyy-MM-dd");
        fstr = _api.Get_URL(_database, _stockcode, ((QuandlAPI.QuandlPeriod)_period).ToString(), d1, "{0}", "{1}");

        if (!append)
        {
            Console.WriteLine("[QuandlChart.GetCandles()] calling _store_candles async for " + _stockcode);
            d_store_candles d = _store_candles;
            d.BeginInvoke(fstr.Replace("&rows={1}", ""), d2, null, null);

            err = _api.GetCandlesTable(string.Format(fstr, "{0}", QuandlAPI._MAX_JSON), d2, out _dohlcv);
            return (err == null) ? 0 :err.ToInt();
        }
        else
        {
            if (DateTime.Parse(d2) < DateTime.Parse(d1)) d2 = string.Empty;

            err = _api.GetCandlesTable(fstr.Replace("&rows={1}", ""), d2, out dt, _tname);
            if (err != null)
                return err.ToInt();

            no_candles = (dt.Rows.Count > 0) ? _dbc_wr.AppendTable(dt): 1;
            dt = null;
            return no_candles;
        }
    }
    
    ...
    
    private void _init_candles()
    {
        _last = _dbc_wr.InitCandles(_period, _stockcode, out _tname);
    }

    private bool _is_append(out string d1)
    {
        bool b = false;
        d1 = QuandlAPI._1ST_DATE;

        if (!string.IsNullOrEmpty(_last.D))
        {
            b = true;
            d1 = _last.D.Replace("/", "-");
        }

        return b;
    }

    private void _store_candles(string fstr, string d2)
    {
        DataTable dic = default(DataTable);
        QuandlAPI.QuandlError err = default(QuandlAPI.QuandlError);
        WnF_DBType dbt = (WnF_DBType)Properties.Settings.Default.dbms;
        string cstr;

        err = _api.GetCandlesTable(fstr, d2, out dic, _tname);
        if (err != null)
        {
            Console.WriteLine("[QuandlChart._store_candles()] GetCandlesTable failed...\r\n" + err.message);
            return;
        }

        cstr = string.Format(Properties.Settings.Default.dbConn, _database);
        using (WnFDbConnectionWrapper dbcw = WnFDbConnectionWrapper.GetWrapper(dbt, cstr))
            dbcw.InsertTable(dic);

        dic = null;
    }
}


    ※ Next blog post will cover the database connection wrapper class.
    

2017년 8월 26일 토요일

Developing ElliottBrowser for Quandl.Com - 1


Downloading / Storing Chart Data Incrementally - 1


    If we get chart data locally, i.e., from a local file system or a database, we probably do not have to worry about performance. However, since ElliottBrowser for Quandl.Com fetches necessary data for charting from the Quandl's web sites, the size of data being requested is a big problem.

    Assuming we need a daily chart covering the last 3 years, should ElliottBrowser download 600 or more records every time it connect? What if we need the data not once but very frequently?

▷ Functional Design


    1.  JSON rather than XML - Quandl.Com supports both, but we use JSON.   ※ Note: JSON vs XML

    2.  Incremental Download - For a given stock, its chart data once downloaded, the next time ElliottBrowser connects to Quandl it downloads only the latest records which need to be updated or added.

    3. Database essential to Incremental Download - The downloaded data is stored in a database as a reliable data store.


▷ Some Technical Specifics


    Let's take a look at the Quandl.Com's JSON response format for chart data requests. ※ Note: Check the HTTP request URL format for Quandl.Com


Fig 1. Quandl's JSON Response Format for Chart Data

    We need to transform the JSON response string into a data type that fits our purpose. Of course, our goal is to store the time series data contained in the string in a database or display it as a chart with some additional analysis data.


    1. Deserializing JSON string using Json.NET

    We will use one of JsonSerializer.Deserialize methods, which deserializes the JSON structure contained by a reader into an instance of the specified type. See the API document.

 public Object Deserialize(
  JsonReader reader,
  Type objectType
 )

    Let's define a data type representing the JSON string returned by Quandl. As shown in Fig 1, the whole response string is a set of only one element which is actually a key-value pair with key 'dataset_data', value part in turn being a set containing the time-series 'data'. We map the root-level set into 'QuandlDataWrapper' type, and the value part of the key-value pair into 'QuandlData' type. See below.

    public class QuandlDataWrapper
    {
        public QuandlData dataset_data
        {
            get { return _dataset_data; }
            set { _dataset_data = value; }
        }

        private QuandlData _dataset_data;
    }


    public class QuandlData
    {
        public string limit
        {
            get { return _limit; }
            set { _limit = value; }
        }

        public string transform
        {
            get { return _transform; }
            set { _transform = value; }
        }

        public int[] column_index
        {
            get { return _column_index; }
            set { _column_index = value; }
        }

        public string[] column_names
        {
            get { return _column_names; }
            set { _column_names = value; }
        }

        public string start_date
        {
            get { return _start_date; }
            set { _start_date = value; }
        }

        public string end_date
        {
            get { return _end_date; }
            set { _end_date = value; }
        }

        public string frequency
        {
            get { return _frequency; }
            set { _frequency = value; }
        }
        
        //
        // The property representing the time-series which is labeled with 'data'
        // "data":
        // [
        //  ["2017-08-23",159.07,160.47,158.88,159.98,19198189.0],
        //  ["2017-08-22",158.23,160.0,158.02,159.78,21297812.0],
        //  ["2017-08-21",157.5,157.89,155.1101,157.21,26145653.0]
        // ],
        //
        public object[] data
        {
            get { return _data; }
            set { _data = value; }
        }
        
        public string collapse
        {
            get { return _collapse; }
            set { _collapse = value; }
        }

        public string order
        {
            get { return _order; }
            set { _order = value; }
        }

        private string _limit;
        private string _transform;
        private int[] _column_index;
        private string[] _column_names;
        private string _start_date;
        private string _end_date;
        private string _frequency;
        private object[] _data;
        private string _collapse;
        private string _order;
    }


    The 'data' property of QuandlData represents the time-series chart data and currently is of type array of objects, each element of which itself an array of mixed types, i.e., a string for a date and multiple numbers.

    These two type definitions, QuandlDataWrapper and QuandlDate, can fulfill our deserialization task of Quandl.Com's JSON string. But in runtime, ElliottBrowser must convert the time-series object, actually of JArray type, into an array of strings to iterate and get the numbers which correspond to a quote data of a specific date. By defining a simple JsonConverter and a type, let's say 'TimeSeries', we can avoid such a hassle by changing the type of property 'data' from array of objects to array of TimeSeries'.

    [JsonConverter(typeof(TimeSeriesConverter))]
    public class TimeSeries
    {
        public string Date { get; set; }
        public double[] Values { get; set; }
    }

    class TimeSeriesConverter : JsonConverter
    {
        public override bool CanConvert(Type objectType)
        {
            return (objectType == typeof(TimeSeries));
        }

        public override object ReadJson(JsonReader reader, Type objectType, object existingValue, JsonSerializer serializer)
        {
            JArray ja = JArray.Load(reader);
            TimeSeries ts = new TimeSeries();
            ts.Date = (string)ja[0]; ja.RemoveAt(0);
            ts.Values = ja.Select(jv => (double)jv).ToArray();
            return ts;
        }

        public override void WriteJson(JsonWriter writer, object value, JsonSerializer serializer)
        {
            JArray ja = new JArray();
            TimeSeries ts = (TimeSeries)value;
            ja.Add(ts.Date);
            ja.Add(ts.Values);
            ja.WriteTo(writer);
        }
    }


    Since defining the required data types is over, let's get our feet wet. First, we deserialize the response string,

    public static object GetJSONObjects(string url, Type t)
    {
        WebRequest request = default(WebRequest);
        WebResponse response = default(WebResponse);
        object result = null;
        JsonSerializer s = new JsonSerializer();

        request = WebRequest.Create(url);
        response = request.GetResponse();

        if (((HttpWebResponse)response).StatusDescription != "OK")
        {
            Console.WriteLine(((HttpWebResponse)response).StatusDescription);
        }

        using (Stream dataStream = response.GetResponseStream())
        {
            using (StreamReader reader = new StreamReader(dataStream))
            {
                using (JsonReader jrdr = new JsonTextReader(reader))
                {
                    result = s.Deserialize(jrdr, Type.GetType(t.FullName));
                }
            }
        }

        response.Close();
        return result;
    }


    and, store time-series data to a DataTable object.

    public QuandlError GetCandlesTable(string fstr, string end_date, out DataTable dic, string tname = "")
    {
        QuandlError err = default(QuandlError);
        QuandlDataWrapper result = default(QuandlDataWrapper);
        DataRow r = default(DataRow);
        string req_url = string.Format(fstr, end_date);
        int ccnt = 0, rcnt = 0;
        dic = _candles_table(tname);

        try
        {
            result = (QuandlDataWrapper)WnFElliottBrowser.GetJSONObjects(req_url, typeof(QuandlDataWrapper));
        }
        catch (WebException ex)
        {
            int status = (int)((HttpWebResponse)ex.Response).StatusCode;
            err = GetQuandlError(ex);
            Console.WriteLine("Exception at QuandlAPI.GetCandlesTable() GetJSONObjects returned {0}", status);
        }

        rcnt += 1;
        ccnt = result.dataset_data.data.Length;
        for (int i = result.dataset_data.data.Length-1; i>= 0; i--)
        {
            TimeSeries v = result.dataset_data.data[i];
            r = dic.NewRow();
            r["DateTime"] = v.Date.Replace("-", "/");
            r["Open"] = v.Values[0];
            r["High"] = v.Values[1];
            r["Low"] = v.Values[2];
            r["Close"] = v.Values[3];
            r["Volume"] = v.Values[4];
            dic.Rows.Add(r);
        }

        result = null;
        return err;
    }

    private DataTable _candles_table(string tname = "")
    {
        DataColumn col;
        DataTable dohlcv = new DataTable();
        if (string.IsNullOrEmpty(tname))
        {
            col = new DataColumn("row_num", typeof(Int32));
            col.AutoIncrement = true;
            col.AutoIncrementSeed = 0;
            dohlcv.Columns.Add(col);
        }
        else
            dohlcv.TableName = tname;

        dohlcv.Columns.Add("DateTime", typeof(string));
        dohlcv.Columns.Add("Open", typeof(double));
        dohlcv.Columns.Add("High", typeof(double));
        dohlcv.Columns.Add("Low", typeof(double));
        dohlcv.Columns.Add("Close", typeof(double));
        dohlcv.Columns.Add("Volume", typeof(double));
        dohlcv.PrimaryKey = new DataColumn[] { dohlcv.Columns["DateTime"] };
        return dohlcv;
    }


    ※ Next blog post will cover database-related content.


2017년 8월 24일 목요일

Developing ElliottBrowser for Quandl.Com - Intro


▶ Brief description of ElliottBrowser


    ElliottBrowser is a tool for Elliott wave analysis, mainly based on the methods described in the Glenn Neely's book, 'Mastering Elliott Wave'.

    It's main functionality is to display 'structure-and-progress notations' of waves in chart data of stocks - See Fig 1.

    ElliottBrowser for Quandl.Com uses free data gathered from Quandl.Com, especially its WIKI database.


Fig 1. ElliottBrowser


▶ Usecases


    - Downloading / storing the list of the stocks in Quandl.Com's WIKI database
    - Refreshing the list when needed
    - Displaying the list
    - Downloading / storing chart data incrementally on-demand
    - Applying Elliott wave analysis to extract structure-and-progress notations of waves
    - Charting


▶ Prerequisites


   - .Net framework 4.5 or above
    - Microsoft SQL Server Compact 4.0
    - Visual Studio Community 2015
    - Quandl.Com account


Storing / Refreshing the List of the Stocks in WIKI database


    When a user using ElliottBrowser wants to view a chart of a stock, he first needs to lookup its ticker symbol (or shortly symbol) or to select an item in the list of stock symbols. So, ElliottBrowser provdes a panel for that purpose. See Fig 2.


Fig 2. The Panel of Symbols

    Quandl.Com provides the list of stock symbols in the WIKI database through the URL "https://www.quandl.com/api/v3/databases/WIKI/codes.json". When accessing the URL using a web browser, it saves the response data as a .zip file rather than displaying it as some form of JSON string.

    To prepare the panel of symbols, should ElliottBrowser download the .zip file and unzip to extract the symbols every time it is starting? It seems to be reasonable. But, what if the .zip file in Quandl.Com remain unchanged for a while?


▷ Functional Design


    1. When ElliottBrowser accesses Quandl.Com for the first time, it downloads and stores the .zip file containing the list of stock symbols to a local disk as it is. Of course, it should extract the contents of the .zip file and prepare the panel of symbols.

    2. After that, when it is starting, it initiates 2 threads, one for extracting symbols from the local .zip file to prepare the panel, and the other for fetching the remote .zip file to compare it with the local file. When they mismatch, the second thread saves the new .zip file and notifies so that ElliottBrowser can refresh the panel of symbols.


▷ Some Technical Specifics


    1. How to get the list of symbols

    The .zip file contains only one .csv file with each line corresponding to a symbol-description pair representing a stock as Fig 3 below. To get the list of symbols, we parse each line into a key-value pair, which will be added as an element in a dictionary data type.


Fig 3. Contents extracted from the .zip file

    private Dictionary _zipped_CSV_to_dic(ZipArchive za)
    {
        Dictionary dic = new Dictionary();
        using (var unzipped = za.Entries[0].Open())
        {
            using (var reader = new StreamReader(unzipped, Encoding.ASCII))
            {
                string line, symbol, name;
                string[] arr, arr1;
                dic = new Dictionary();

                while ((line = reader.ReadLine()) != null)
                {
                    arr = line.Trim().Split(',');
                    arr1 = arr[0].Split('/');
                    symbol = arr1.Length > 1 ? arr1[1] : arr[0];
                    name = line.Replace(arr[0] + ",", string.Empty).Replace("\"", string.Empty)
                                .Replace("Prices, Dividends, Splits and Trading Volume", string.Empty).Trim();
                    dic[symbol] = name;
                }
            }
        }
        return dic;
    }


    2. Downloading and comparing the .zip file with the local .zip previously stored

    The .zip file is fetched as a content in a HttpWebResponse, and is extracted to get the .csv file using ZipArchive class in System.IO.Compression library in .Net 4.5. After that, using MD5 hash in System.Security.Criptyography library, the .csv is compared with that contained in the previously stored .zip file.

    delegate void d_refreshSymbols(string symbols_fstr, string database, ref Dictionary dic, ref int err);

    private void _refresh_symbols(string symbols_fstr, string database, ref Dictionary dic, ref int err)
    {
        string url, path;
        HttpWebResponse response = default(HttpWebResponse);
        url = string.Format(symbols_fstr, database);

        var webRequest = (HttpWebRequest)WebRequest.Create(url);
        try
        {
            response = webRequest.GetResponse() as HttpWebResponse;

            if (response.ContentType == "application/zip")
            {
                bool to_serialize = true, overwrite = false;
                path = _home + Path.DirectorySeparatorChar + database;
                if (!Directory.Exists(path)) Directory.CreateDirectory(path);
                path += Path.DirectorySeparatorChar + response.ResponseUri.AbsolutePath.Substring(1);
                Properties.Settings.Default.symbolsPath = path; Properties.Settings.Default.Save();

                using (var mstr = new MemoryStream())
                using (var str = response.GetResponseStream())
                {
                    str.CopyTo(mstr);
                    ZipArchive zipArchive = new ZipArchive(mstr, ZipArchiveMode.Read);

                    if (File.Exists(path))
                    {
                        using (Stream input = File.OpenRead(path))
                        {
                            var serialized = new ZipArchive(input, ZipArchiveMode.Read);
                            using (var md5 = MD5.Create())
                            {
                                var h1 = System.Text.Encoding.UTF8.GetString(md5.ComputeHash(zipArchive.Entries[0].Open()));
                                var h2 = System.Text.Encoding.UTF8.GetString(md5.ComputeHash(serialized.Entries[0].Open()));
                                to_serialize = overwrite = (h1 != h2);
                            }
                        }
                    }

                    if (to_serialize)
                    {
                        mstr.Position = 0;
                        using (Stream output = File.OpenWrite(path))
                            mstr.CopyTo(output);

                        if (overwrite)
                        {
                            if (SymbolsUpdate != null) SymbolsUpdate(); err = 0; goto step1;
                        }
                    }

                    dic = _zipped_CSV_to_dic(zipArchive);
                }
    step1:
                err = 0;
            }
            else
            {
                err = (int)APIError.Unknown;
            }
        }
        catch (WebException ex)
        {
            QuandlError qerror = GetQuandlError(ex);
            err = qerror.ToInt();
        }
    }

 
    3. Getting symbols from local, refreshing with one from Quandl

    Once the .zip file being stored locally, ElliottBrowser prepares its panel of symbols using the local file first, while invokes a delegate to check the mismatch between the local and the remote .zip.

    public void RefreshSymbols(out Dictionary dic, out int err)
    {
        string ppath; // The path to the previously stored .zip file
        symbols_fstr = "https://www.quandl.com/api/v3/databases/{0}/codes.json";
        string database = "WIKI";
        dic = new Dictionary();
        err = 0;

        ppath = Properties.Settings.Default.symbolsPath;
        if (!string.IsNullOrEmpty(ppath))
        {
            if (File.Exists(ppath) && !File.GetAttributes(ppath).HasFlag(FileAttributes.Directory))
            {
                string[] parr = ppath.Split(Path.DirectorySeparatorChar);
                if (parr[parr.Length - 2] == database)
                {
                    using (Stream input = File.OpenRead(ppath))
                    {
                        ZipArchive zipArchive = new ZipArchive(input, ZipArchiveMode.Read);
                        dic = _zipped_CSV_to_dic(zipArchive);
                    }

                    d_refreshSymbols d = _refresh_symbols;
                    d.BeginInvoke(symbols_fstr, database, ref dic, ref err, null, null);
                    err = 0; return;
                }
            }
        }

        _refresh_symbols(symbols_fstr, database, ref dic, ref err);
    }


※  The sources of ElliottBrowser for Quandl.Com and its necessary libraries have been published in a GitHub repository.


2015년 2월 27일 금요일

VB.Net Chart tip 1 - AxisY Rescaling

  시계열 데이터를 Chart로 표현하려다 보면 이런저런 많은 문제가 생길 수 있습니다.

  대표적인 것이 주가 차트일 텐데요, 증권사에서 제공하는 HTS를 사용하면, 사용자가 보고자하는 종목의 캔들차트와 보조지표를 하나의 화면에서 쉽게 볼 수 있습니다. 그런데, 어떤 이유에서건 유사한 차트를 VB.Net 또는 C#으로 프로그래밍하려다 보면, 캔들차트와 보조지표를 동시에 출력하는 것만도 쉬운 작업이 아닙니다.

  뿐만 아니라, 마우스로 캔들을 가리킬 때마다 해당 캔들의 시가나 종가를 풍선 도움말로 출력하거나, 해당 날짜의 공시 또는 기사를 적절히 표현하는 등 사용자가 자연스럽게 요구하는 기능들을, 상용 컴포넌트나 라이브러리를 사용하지 않고, 아무것도 없는 밑바닥부터 개발하는 것은 정말 어려운 일이겠지요.
  

그림 1. 차트 샘플


  그렇더라도...? 그래서 '공유'가 중요하다는 생각을 합니다. 첫 번째 주제로, 캔들차트나 Column 차트 또는 Line 차트 등의 'y축 스케일'에 관한 문제을 풀어보도록 하겠습니다.


  • 상황: 차트에 출력해야할 데이터의 y축 값이 특정 이벤트에 의해 변한다.
  • 문제: y축 최대값 또는 최소값을 해당 이벤트에 따라 변경해 주어야 한다.


  위 그림 1은 우리가 흔히 볼 수 있는 캔들차트와 MACD 지표 및 기타 정보를 포함하는 차트로서 정적인 데이터만 표현하는 것처럼 보이지만, 사실은 동적인 이벤트에 따라 값이 달라지는 데이터 또한 출력합니다. 대표적인 이벤트는 마우스 포인터의 이동이나 스크롤바의 이동 등일 것입니다.
  
  이 글의 주제와 직접적인 연관이 있는 것이 스크롤바의 이동입니다. 차트 화면 크기의 제약으로 인해 실제 캔들의 수보다 훨씬 적은 갯수의 캔들만을 출력해야만 가시성이 좋은 경우가 대부분이며, 따라서 스크롤바를 사용하는 것이 일반적입니다. 참고로, 그림 1의 차트에 연결된 데이터소스는 다음 그림 2와 같습니다. 전체 데이터의 갯수, 즉 캔들의 수가 1,853 개인데, 이 모두를 한 화면에 담는다면 보기가 쉽지 않겠지요?
    

그림 2. 차트의 DataSource

  
  그런데, 원하는 부분을 찾기 위해 스크롤바를 움직일 때, 차트에 출력되지 않는 캔들을 제외하고, 실제로 차트에 출력되는 캔들의 고점과 저점에 맞추에 y축 값의 범위가 변하게끔 해야할 것입니다. 그렇게 하지 않고, 전체 캔들 중의 최고가와 최저가로 y축 범위를 고정시켜 버린다면, 차트가 화면의 위 또는 아래쪽에 치우쳐 가시성이 떨어지는 경우가 생깁니다. 반대로, 화면에 출력해야할 캔들의 고점 및 저점과는 상관없는 값으로 범위를 지정하면, 캔들이 차트에서 사라질 수도 있습니다.
  
  상황과 문제를 장황하게 서술했지만, 답은 간단합니다. 스크롤바를 움직일 때,

  1. 스크롤바의 위치를 구한다.
  2. 1의 결과를 가지고 전체 데이터 중에서 차트에 출력되어야할 데이터의 범위를 찾는다.
  3. 2에서 찾은 데이터, 즉 캔들들의 고점과 저점을 구한다.
  4. AxisY의 Maxumum과 Minumum 값을 3에서 찾은 값으로 지정한다.
  
  우선, 1 ~ 4에 필요한 문법(in VB.Net)을 소개하면 다음 그림과 같습니다.
  

그림 3. 관련 문법 (VB.Net)
  
  2 ~ 3(그림 3의 ②, ③)의 과정은 차트의 DataSource type이나 실제 데이터의 종류에 따라 달라지겠지만, 1 ~ 4의 맥락은 동일할 것입니다. 단, 위 그림 3의 샘플 소스는 보조지표가 포함되지 않은 캔들차트를 대상으로 한 것이며, ④의 내용 중 '0.05 * (mx - mn)'은 차트 상하에 약간의 여분을 두기 위함입니다.
  
  하나의 차트에 출력해야할 시리즈(계열, series)의 수가 위 샘플 소스에서 가정한 것처럼 한 개가 아니라 여러 개이면 어떻게 해야할까요? 두 가지의 경우를 고려해야 합니다.
  
  첫 번째 경우는 모든 시리즈의 YAxisType이 AxisType.Primary인 경우입니다. 즉, y축이 하나인 것이죠. 이 경우에는 단순하게 시리즈 고점들 중의 최고점과 시리즈 저점들 중의 최저점을 y축의 범위로 지정하면 그만입니다.
  
  두 번째 경우는 위 그림 1과 같이 AxisType.Primary와 AxisType.Secondary를 모두 사용할 때입니다. 캔들차트를 Primary축, 즉 AxisY에 대응시키고, 보조지표는 Secondary축 AxisY2에 대응시켰는데, 축 값의 scale이 서로 다릅니다. AxisY와 AxisY2의 Minimum 및 Maximum을 각각 어떤 값으로 지정해야 할까요?
  
  캔들차트나 보조지표 등 시리즈들을 어떻게 배치하는냐에 따라 달라질텐데요, 그림 1처럼 배치한다고 가정하겠습니다. 즉, 화면을 수직으로 5등분한 후, 보조지표를 제일 하단에 위치시키는 것입니다.
  

그림 4. Axis의 범위 지정
  
  Primary축, 즉 AxisY의 Maximum은 차트에 출력되는 캔들 중 최고점으로 지정합니다(ⓐ). 캔들 중 최저점을 구하고(ⓑ), 그 차이를 4로 나누면 그림 4의 h1값이 되겠지요? 그렇다면, AxisY의 Minimum값(그림 4의 m)은 'AxisY2.Minimum - h1'입니다.
  
  비슷한 방법으로 AxisY2의 Minimum과 Maximum값을 구할 수 있습니다. AxisY2.Minimum은 그림 4의 ⓒ처럼 대응시키면 되고,  M은 'AxisY2.Minimum + 5 * h2'로 지정하면 될 것입니다.
  
  샘플 소스는 다음 그림을 참고하시기 바랍니다. 상하 여백을 감안한 샘플입니다.
  

그림 5. 샘플 소스


2014년 12월 3일 수요일

네오위즈인터넷 Charts (2014-12-02)


▶ 특이사항
  
    거래량이 3배 이상 증가하면서, MACD oscillator가 signal line을 golden cross
  

그림 1. MACD oscillator, signal line golden cross
  
▶ 엘리어트 패턴
  
    일봉에서 지그재그(:5-:3-:5) 패턴의 하락 조정 완성을 기다림 - 지그재그의 세 번째 파동이 한 단계 낮은 수준(degree)의 충격패턴 중 :L5로 마감될 것을 기대
  

그림 2. 일봉 엘리어트 패턴
  
    60분봉에서도 한 단계 더 낮은 수준의 :L5를 완성하는 상승 되돌림을 확인할 수 있는데, 이 되돌림이 두 단계의 수준을 동시에 완성하는 것으로 보임
  

그림 3. 60분봉 엘리어트 패턴

    일봉이 장대 양봉이지만, 60분봉에서 역망치형 캔들이 발생했으므로, 하락조정이 연장될 것인지 확인할 필요가 있음