2017년 9월 6일 수요일

Developing ElliottBrowser for Quandl.Com - 6


Getting the Sources and Running


    ElliottBrowser for Quandl.Com is a .NET form application written in C#, and its main functionalities can be summarized as 'a tool for technical analysis of US stocks, with data fed from Quandl'.

    Of course, free data provided by Quandl are not limited to US stocks, so anyone who want to analyze other data from Quandl or any data from any other data provider may use ElliottBrowser after modifying it a bit accordingly.


▷ Getting and Building the Sources


    The sources of ElliottBrowser for Quandl.Com and its necessary libraries have been published in a GitHub repository.

    In the source tree, is a Visual Studio solution file. After cloning or downloading the repository, it is enough to open and build the solution file with Visual Studio Community 2015 or compatible.


▷ Running ElliottBrowser


    As stated, it is necessary to have a valid Quandl API key to run ElliottBrowser. If it's not the case, visit Quandl and register to get a free account first.

    Every time when ElliotBrowser is starting, it tries to read one of its .ini file to get an API key. If it fails, it prompts the user to fill in a key. See below.


Fig 1. Running ElliottBrowser for Quandl.Com


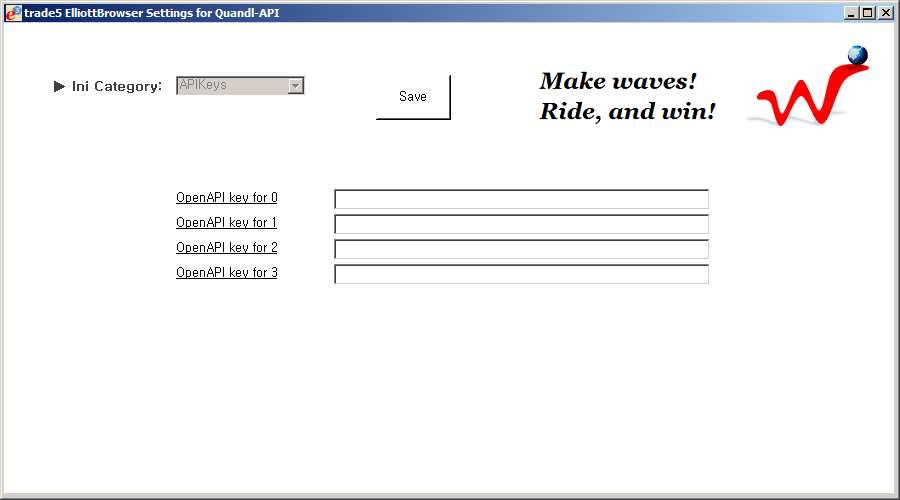
Fig 2. Filling in an API key

    As in Fig 2, after filling in at least one API key, click 'Save', and then click 'Data Provider' button in the main toolbar (See Fig 1).

    Again, ElliottBrowser tries to read URL format string of Quandl API, and prompts the user if it fails.


Fig 3-1. Ini file checking


Fig 3-2. Ini file checking


Fig 4. Setting a default dataset

    Set the 'DatabaseDefault' field to 'WIKI', and the 'DatasetDefault' field to any valid ticker symbol, and click 'Save'.

    After that, click the 'Data Provider' button in the main toolbar once again.


▷ Using ElliottBrowser


    To learn the basic usages, please check the previous blog post.


2017년 9월 1일 금요일

Developing ElliottBrowser for Quandl.Com - 5


User Interface of ElliottBrowser


    ElliottBrowser is a .NET form application which will be developed using Visual Studio Community 2015 having no other 3-party UI components.

    Let's look at its main form. It contains a StatusStrip and a horizontal SplitContainer with fixed Panel1 in which a ToolStrip is docked.


Fig 1. ElliottBrowser's Main Form

    Inside the Panel2 of the SplitContainer, another vertical SplitContainer will be docked, which has fixed Panel1 to be added the panel of symbols docked inside and Panel2 being to have a panel of charts. See Fig 1 of the first blog post in this series.

    The chart panel of ElliottBrowser is a UserControl 'CChartPanel', which is also a horizontal SplitContainer having a ToolStrip docked in fixed Panel1, and a Chart control and a DataGridView control in Panel2. See below.


Fig 2. Chart Panel, CChartPanel


▷ Functional Design


   - Main ToolStrip


Fig 3. Main ToolStrip

  1. When clicked, the panel of symbols shows up or disappears.
  2. A ToolStripComboBox lists ticker symbols once requested by a user. When a user requests a chart of a stock through the panel of symbols, corresponding ticker symbol is added to the list. When an item in the list is selected, the chart of the selected symbol is displayed.
  3. A ToolStripButton toggles the multiple selection mode of period buttons in 4 on/off. When the mode is on and two or more period buttons are checked, multiple charts per checked button are displayed.
  4. ToolStripButtons for supported periods are enabled. When clicked, they toggle themselves check/unchecked. ※ Supported periods are dependent to the data provider. Quandl.Com supports only monthly, weekly and daily charts.
  5. A TextBox, when a valid number entered, sets the number of candlesticks in all displayed charts.
  6. A ToolStripSplitButton, when a dropdown button clicked, selects a data provider and verifies the configuration files of the provider to check API keys and URLs.
  7. When clicked, a form displaying the information of ElliottBrowser shows up.


    - Panel of Symbols


Fig 4. The Panel of Symbols

  1. A ListView lists ticker symbols in Quandl.Com's WIKI database. When an item in the list is clicked, the corresponding ticker symbol is added to the ToolStripComboBox (Fig 3. 2) in the main ToolStrip, while ElliottBrowser displaying the charts.
  2. A ComboBox accepts and lists user inputs for search. When a user inputs a string into box, the panel of symbols searches for the string among the list of symbols and highlights one, if any searched.
  3. If clicked, the panel of symbols searches an item with the string in the ComboBox.


    - CChartPanel Tool Bar


Fig 5. CChartPanel Tool Bar

  1. A ToolStripSplitButton has dropdown items for chart periods, monthly, weekly, daily, and minutes. By default, its action is disabled and displays the period of the chart only.
  2. A ToolStripComboBox lists supported periods less than daily. By default, it is disabled.
  3. A TextBox, when a valid number entered, sets the number of candlesticks in the chart.
  4. A HScrollBar sets the number of candlesticks in the chart.
  5. A ToolStripSplitButton has dropdown items for supported technical indicators other than TiESPN, TiESPNfr, and PFTW in WnFTechnicalIndicators.dll. If one of the dropdowns is clicked, corresponding technical indicator is displayed in the chart.
  6. A ToolStripSplitButton has dropdown items for TiESPN, TiESPNfr and PFTW (Bill Williams' Profitunity Window).
  7. A ToolStripButton changes the mode of mouse action on the chart cyclically from 'SP Notation' → 'Trend Line' → 'Ratio' → 'SP Notation'. 
  8. A ToolStripButton, which is enabled when the mode of the button 7 is 'Trend Line' or 'Ratio', shows a ColorDialog to choose the line color.
  9. A ToolStripSplitButton has two dropdown items to print the chart either to a printer or to an image.
  10. If clicked, the UI control of the chart panel is toggled to either Chart for charting or DataGridView to view the data source of the chart.


    - The modes of mouse action on the Chart control

      SP Notation: If a user draws a horizontal block on the chart to select a wave, ElliottBrowser analyzes the wave, while regarding it as a mono-wave, and displays the result, i.e., its SP notation.
 
      Trend Line: Users can draw some straight lines on the chart.
 
      Ratio: If a user subsequently draws two straight lines so that they are connected to each other, the retrace ratio of the second line to the first is displayed, and the target range of 1.618 to 2.618 times of the first line is also depicted with two horizontal strip lines.